Version 2.2 Release
Version 2.2 Release
Version 2.2 of Backseat Geologist is now available on the App Store and Play Store. This update brings Japanese localization, new map data options, and improved paleogeography display. It also has a few other improvements and a new user interface guide behind the little “i” button on the right side.
Japanese Localization
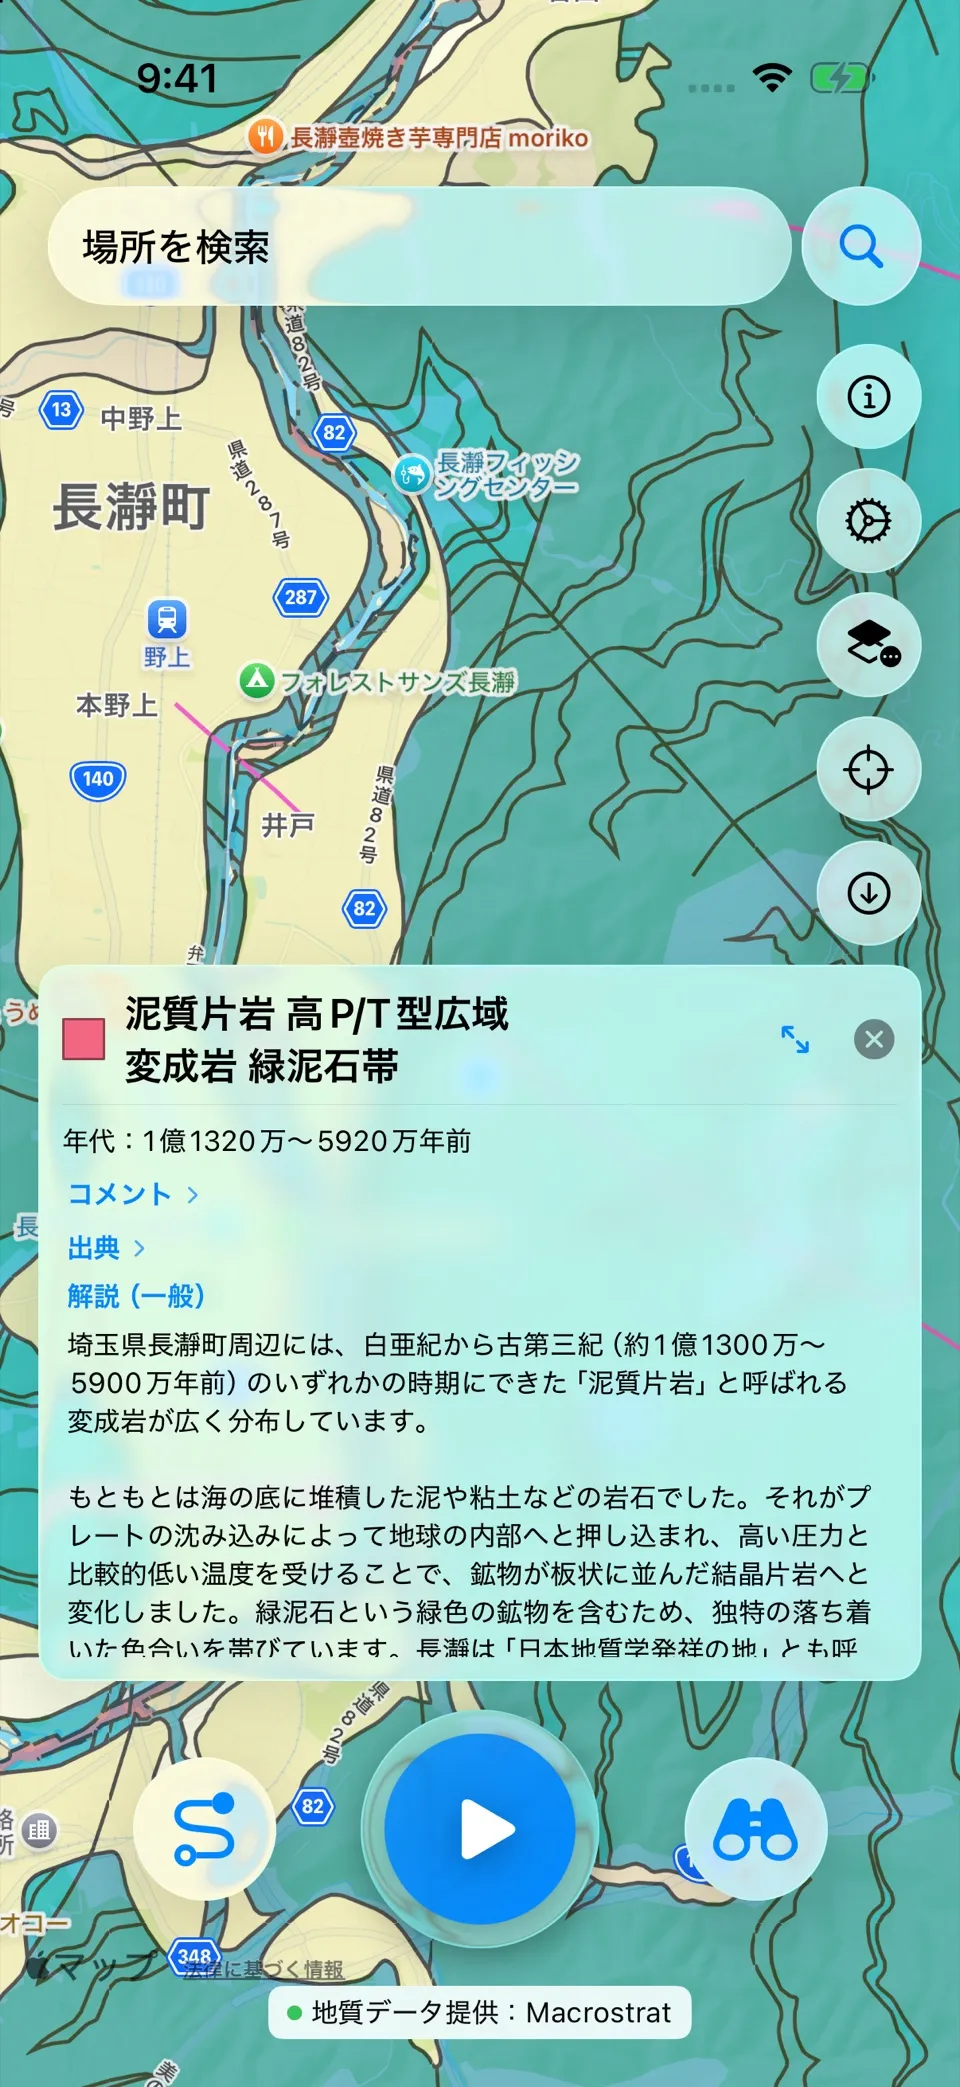
Macrostrat has recently released better resolution maps for Japan making it suitable for geology narration in the country. The maps for Japan are very detailed and include many faults and other features. I’ve translated the app into Japanese and version 2.2 will be the first release available in the country. Japan is a geologically dynamic country and a great place to see volcanoes and the results of tectonic processes.
New Map Data
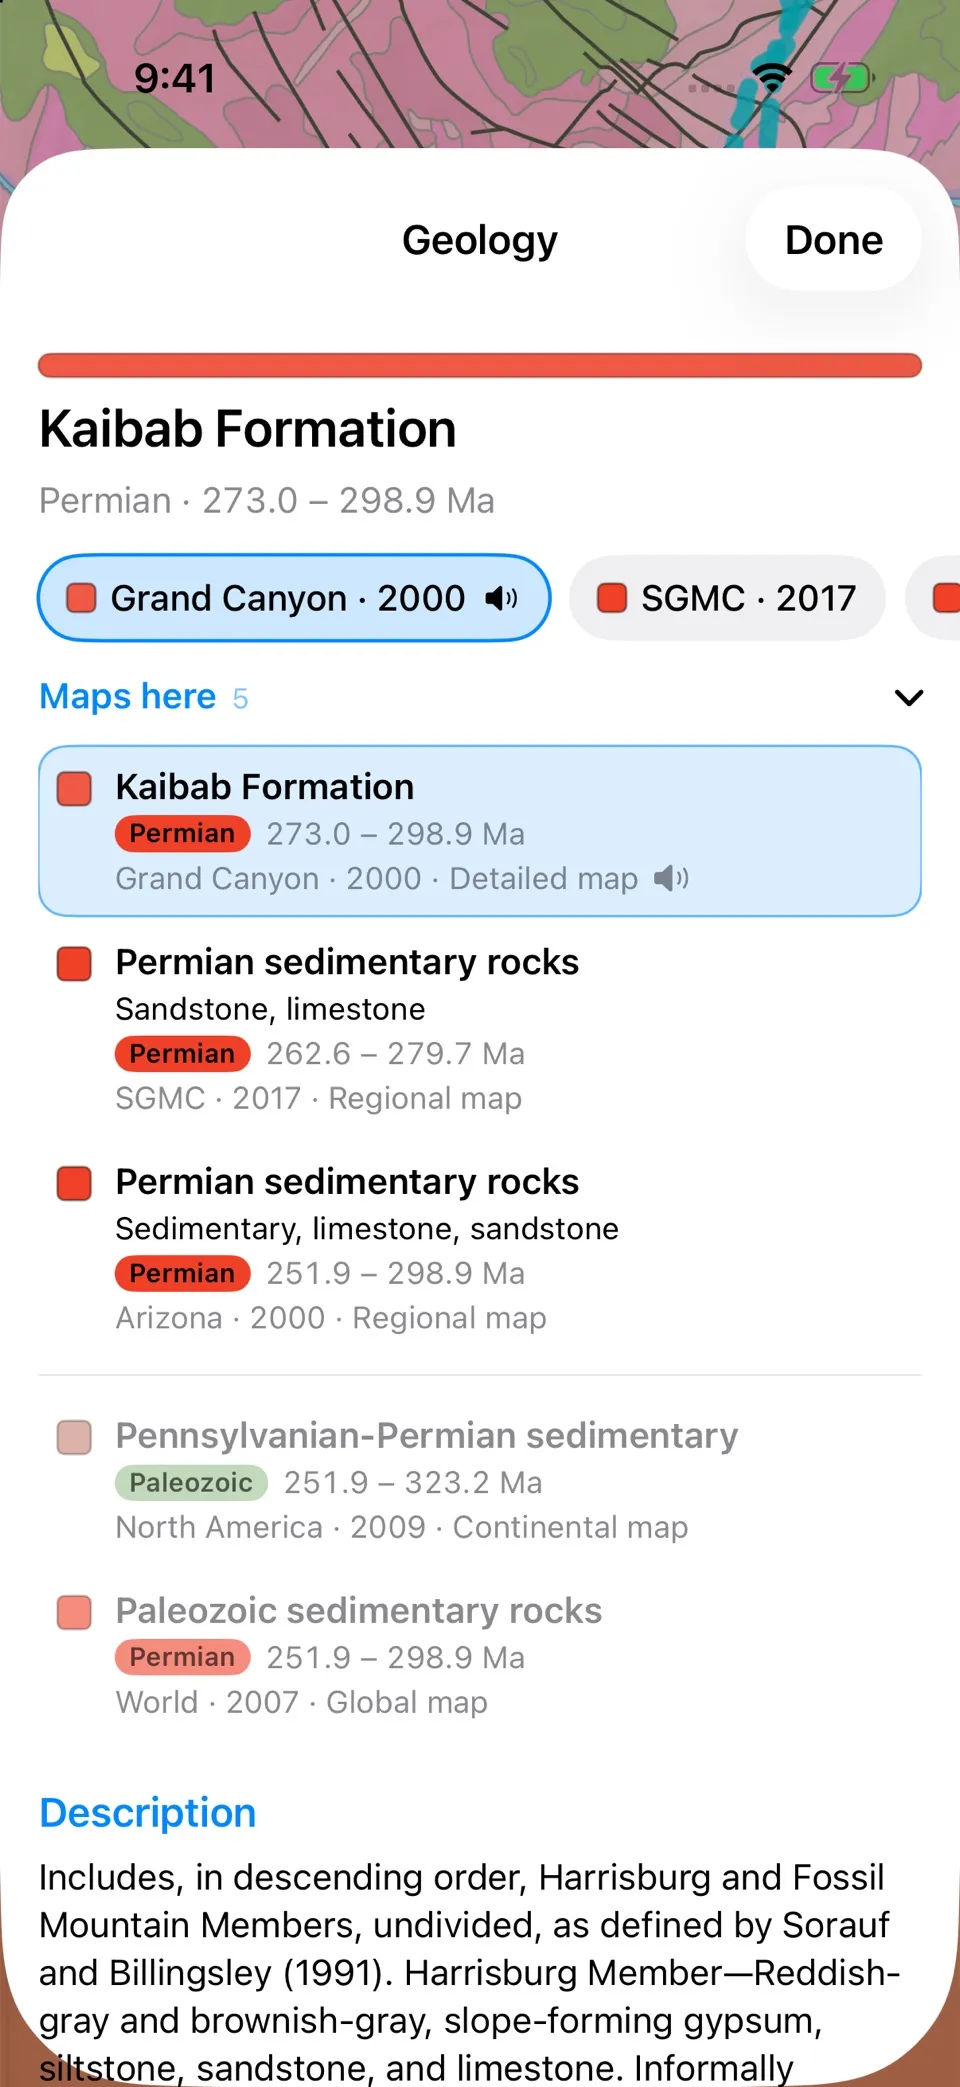
Along with new maps for Japan, Macrostrat is progressively releasing new maps across the globe. This presents a bit of a challenge to Backseat Geologist. I have to choose which map data is the best for creating a geology narration for the user between multiple options at a given location. Maps with a complete legend, meaning real ages and map colors, win as long as they’re nearly as detailed as the most detailed map available. If none qualifies, the most detailed map wins. When a coarser map is chosen but a more detailed one describes the same formation in more depth, the narration borrows that richer description and credits the map it came from. This system is able to adapt as new maps and legends are added in the Macrostrat API and I can edit the rules on the server so an app update is not required going forward.
The geology info panel and detail sheet now adapt to this as well. From the panel you can select different map units based on the overlapping maps of a given point. You can compare how the rocks of that location were mapped at different scales and times. Some locations have surficial descriptions instead of bedrock. Typically the largest scale maps will have the most detailed and accurate information.
Paleogeography Globe
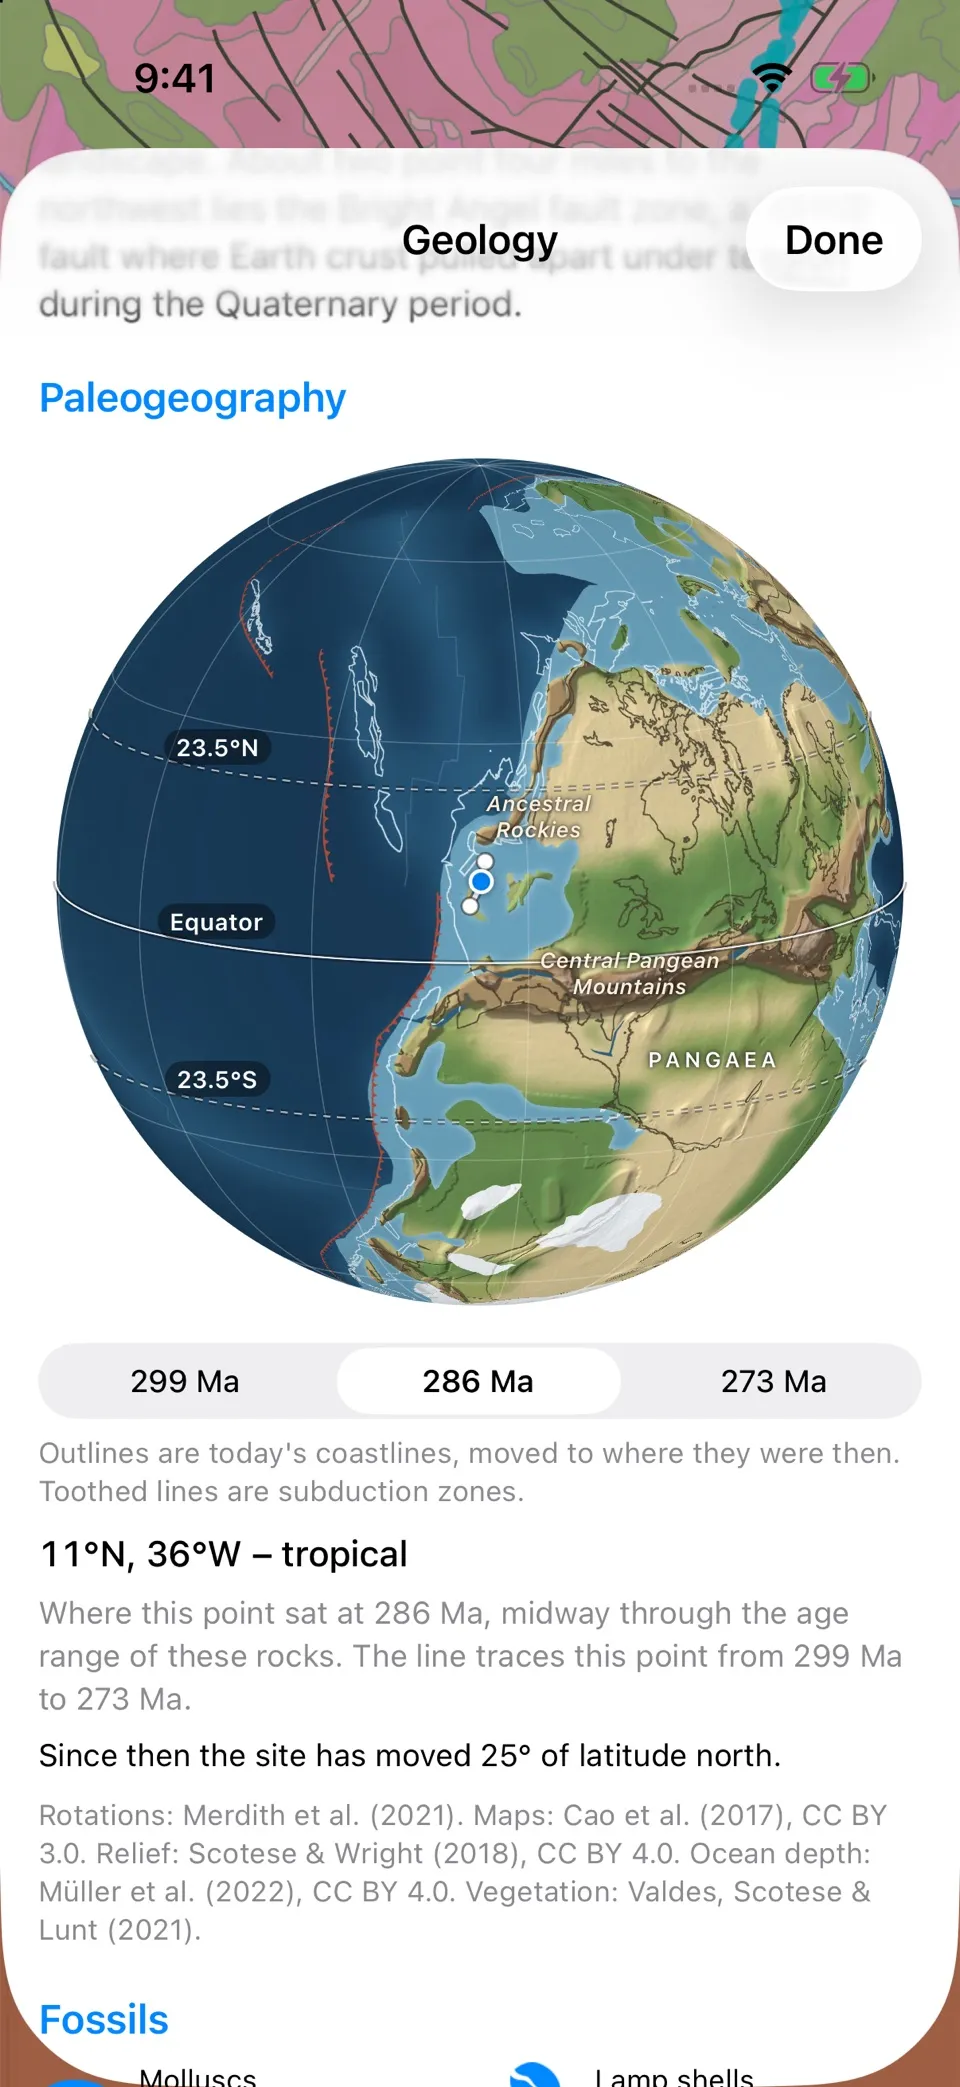
Since the release in version 2 I’ve been looking for ways to make the paleogeography view better. It now shows as a globe with topographic relief, sea floor bathymetry, vegetation reconstruction, and better subduction and spreading graphics. For now the globe is static and does not spin.
Paleogeography Reconstruction Details
Each map starts from Cao et al. (2017), which outlines land, mountains and shallow seas back to about 400 million years ago. The outlines are stored in present-day coordinates, and each one is tagged with the tectonic plate it sits on, so any plate model can carry them back in time. I use the Merdith et al. (2021) plate model. Cao’s outlines line up with it, and in my tests it put ancient reefs and glacial deposits at more believable latitudes than PALEOMAP, the standard, slightly older, paleogeography model. The app moves the location back with the Merdith model which is downloaded and the calculation runs on the phone, so it works offline.
Relief comes from Scotese and Wright’s (2018) paleo-elevation grids. They were made for PALEOMAP, so my pipeline moves them into Merdith’s model one grid cell at a time: back to the present day with one model, then forward with the other. The two reconstructions don’t always agree on where the mountains were so Cao’s map decides where mountains stand, and the elevation grid only adds texture. Mapped mountain belts are raised onto a 900-metre floor to help every range stand out. Lowlands stay at about a third of the grid’s height, capped at 450 m, so they never look like mountains.
The sea floor uses seafloor-age grids from Müller et al. (2022), which were made for Merdith’s model. Ocean crust sinks as it cools, so young crust near the spreading ridges is shallow and old crust is deep. A standard cooling curve (Stein and Stein, 1992) converts age to depth.
Vegetation comes from climate model runs by Valdes, Scotese and Lunt (2021): 109 time slices covering the last 541 million years. Where the model grew plants, the globe is green. Where it left bare ground, the globe is tan, which leaves the interior of Pangaea bare around the Navajo sand sea 196 million years ago. The model only knows modern plant types, so I use it to show plants versus bare ground and how much is forest, not what actually grew. Going back in time, the green fades from 385 million years ago and is gone by 430, when land plants were still small and scarce.
Subduction zones have teeth on the overriding plate and spreading ridges are drawn faintly. Today’s coastlines sit on top as a faint outline so you can find your bearings. Cao’s maps stop around 400 million years ago. Beyond that the globe shows land and sea from Merdith’s own plate outlines, with relief back to 540 million years and plain land and sea back to a billion years.
All of this is computed ahead of time in Python with pyGPlates. The pipeline renders 201 maps, one for every 5 million years plus today, each a 4096 × 2048 image of a few hundred kilobytes, served from our server. The app wraps the flat map onto a globe itself, centred on where the spot was at the time, and draws the labels. There are 40 named features, such as Pangaea, the Tethys Ocean and the Western Interior Seaway. The pipeline places each label for every map age and checks it against the map underneath, so a seaway’s name doesn’t end up on dry ground. For a rock unit with a long age range, you can step between its oldest, middle and youngest ages and watch the spot drift along its path.